DECODE Moving Average ToolkitDECODE Moving Average Toolkit: Your All-in-One MA Analysis Powerhouse!
This versatile indicator is designed to be your go-to solution for analysing trends, identifying potential entry/exit points, and staying ahead of market movements using the power of Moving Averages (MAs).
Whether you're a seasoned trader or just starting out, the Decode MAT offers a comprehensive suite of features in a user-friendly package.
Key Features:
Multiple Moving Averages: Visualize up to 10 Moving Averages simultaneously on your chart.
Includes 5 Exponential Moving Averages (EMAs) and 5 Simple Moving Averages (SMAs).
Easily toggle the visibility of each MA and customize its length to suit your trading style and the asset you're analyzing.
Dynamic MA Ribbons: Gain a clearer perspective on trend direction and strength with 5 configurable MA Ribbons.
Each ribbon is formed between a corresponding EMA and SMA (e.g., EMA 20 / SMA 20).
The ribbon color changes to indicate bullish (e.g., green) or bearish (e.g., red) sentiment, providing an intuitive visual cue.
Toggle ribbon visibility with a single click.
Powerful Crossover Alerts: Never miss a potential trading opportunity with up to 5 customizable MA Crossover Alerts.
Define your own fast and slow MAs for each alert from any of the 10 available MAs.
Receive notifications directly through TradingView when your specified MAs cross over or cross under.
Optionally display visual symbols (e.g., triangles ▲▼) directly on your chart at the exact crossover points for quick identification.
Highly Customizable:
Adjust the source price (close, open, etc.) for all MA calculations.
Fine-tune the appearance (colors, line thickness) of every MA line, ribbon, and alert symbol to match your charting preferences.
User-Friendly Interface: All settings are neatly organized in the indicator's input menu, making configuration straightforward and intuitive.
How Can You Use the Decode MAT in Your Trading?
This toolkit is incredibly versatile and can be adapted to various trading strategies:
Trend Identification:
Use longer-term MAs (e.g., 50, 100, 200 period) to identify the prevailing market trend. When prices are consistently above these MAs, it suggests an uptrend, and vice-versa.
Observe the MA ribbons: A consistently green ribbon can indicate a strong uptrend, while a red ribbon can signal a downtrend. The widening or narrowing of the ribbon can also suggest changes in trend momentum.
Dynamic Support & Resistance:
Shorter-term MAs (e.g., 10, 20 period EMAs) can act as dynamic levels of support in an uptrend or resistance in a downtrend. Look for price pullbacks to these MAs as potential entry opportunities.
Crossover Signals (Entries & Exits):
Golden Cross / Death Cross: Configure alerts for classic crossover signals. For example, a 50-period MA crossing above a 200-period MA (Golden Cross) is often seen as a long-term bullish signal. Conversely, a 50-period MA crossing below a 200-period MA (Death Cross) can be a bearish signal.
Shorter-Term Signals: Use crossovers of shorter-term MAs (e.g., EMA 10 crossing EMA 20) for more frequent, shorter-term trading signals. A fast MA crossing above a slow MA can signal a buy, while a cross below can signal a sell.
Use the on-chart symbols for quick visual confirmation of these crossover events.
Confirmation Tool:
Combine the Decode MAT with other indicators (like RSI, MACD, or volume analysis) to confirm signals and increase the probability of successful trades. For instance, a bullish MA crossover combined with an oversold RSI reading could strengthen a buy signal.
Multi-Timeframe Analysis:
Apply the toolkit across different timeframes to get a broader market perspective. A long-term uptrend on the daily chart, confirmed by a short-term bullish crossover on the 1-hour chart, can provide a higher-confidence entry.
The DECODE Moving Average Toolkit empowers you to tailor your MA analysis precisely to your needs.
在腳本中搜尋"RSI MACD"

Regime Scope | mad_tiger_slayerRegimeScope by mad_tiger_slayer
Adapt to the Market’s Mood. Trade in Sync with Regime Scope.
Overview
Regime Scope is an advanced multi-factor market regime identifier meticulously engineered to determine whether an asset is exhibiting trending behavior (Markup/Markdown phases) or mean-reverting dynamics (Sideways - Accumulation/Distribution). By integrating and synthesizing outputs from nine rigorously chosen statistical and volatility-based models, this tool offers a unified framework for assessing regime conditions with precision.
This indicator is best used in conjunction with other tools in your trading arsenal—serving not as a standalone signal generator, but as a high-value filter for confluence and strategic alignment. Whether you're trading breakouts, reversals, or mean-reversion setups, Regime Scope can elevate your system’s contextual awareness and execution timing.
How It Works – Part 1
Regime Scope calculates a composite "regime score" by normalizing and averaging a range of volatility and statistical measures. This score, which ranges between -1 and +1, indicates the likelihood of the market being in a trending versus mean-reverting state.
Values near +1 suggest a strong trending environment.
Values near -1 suggest strong mean-reversion (sideways, volatile) conditions.
Values between -0.30 and +0.30 are considered neutral and indicate choppy or range-bound market behavior.
When the average regime score crosses above the upper threshold, the asset likely enters a trending state.
When it crosses below the lower threshold, the market likely shifts to a volatile, mean-reverting state.
The histogram and dynamic background color provide an intuitive visual guide to the current regime.
How It Works – Part 2: Components
Each of the following sub-models has been carefully selected for its contribution to understanding price behavior. All components are normalized to create a consistent, unified score:
Phillips-Perron Test: Detects the presence of a unit root to infer stationarity and mean-reverting characteristics.
Hurst Exponent: Measures long-term memory in a time series to identify persistence or anti-persistence.
KPSS Test: Tests for level stationarity to contrast against unit-root behavior and validate trending assumptions.
GARCH Volatility: Captures volatility clustering and regime shifts in conditional variance.
Wavelet Transform: Decomposes price action into time-frequency space to extract non-linear and localized dynamics.
Half-Life of Mean Reversion: Estimates the speed at which price returns to its mean, enhancing the timing of reversion plays.
Augmented Dickey-Fuller (ADF) Test: Statistically verifies whether a series exhibits mean-reverting tendencies.
Garman-Klass-Yang-Zhang Volatility: A robust historical volatility measure using open-high-low-close data.
ADX (Average Directional Index): A classic technical tool for quantifying the strength of trend directionality.
How It Works – Part 3: Output Interpretation
All sub-models are normalized and synthesized into a single histogram plot shown in the lower chart panel.
+1.0 to +0.30: Indicates high probability of a directional, trending market.
-1.0 to -0.30: Indicates high probability of a sideways, mean-reverting regime.
-0.30 to +0.30: Suggests a neutral, uncertain market condition.
Transitions above or below these thresholds signal regime shifts.
Background shading adapts in real-time to visually reflect regime classification.
Features
Customizable thresholds to fine-tune sensitivity for regime classification.
Visual overlay positioning (choose from top-left, bottom-right, etc.).
Toggleable reference lines for regime thresholds.
Cross-timeframe consistency through dynamic normalization.
Each sub-model includes adjustable settings for personalized optimization.
Use Cases
Dynamically switch between trend-following and mean-reversion strategies.
Filter out choppy, low-probability zones by avoiding neutral regime periods.
Use regime score as confluence with entry/exit signals from other indicators.
Adapt strategies across timeframes—works well from scalping to swing trading.
Best used on timeframes ≥12H for macro regime context, but scalpers can benefit by using it on shorter windows with tuned parameters.
Scalping Use Case
Overlay the regime score on low timeframes (e.g., 1m–15m) and use it to avoid high chop zones or confirm breakout volume spikes during trending periods.
Long-Term Use Case
On 1D–1W charts, Regime Scope can filter false breakouts and confirm macro trend alignment for position trades or swing setups.
Tip
Combine Regime Scope with traditional technical tools like RSI, MACD, Bollinger Bands, or moving average crossovers to enhance strategic coherence.
For example, only act on breakout or trend-following signals when the regime score exceeds the upper threshold, confirming a high-trend environment.
Conversely, mean-reversion strategies like fading RSI extremes or trading Bollinger Band bounces work best when the regime score is in the lower range.
Aligning your tactical entries with the broader regime can significantly reduce false signals, enhance trade probability, and improve overall system robustness.

HTF EMA Pivot PointsHTF EMA Pivot Points - TradingView Indicator
📌 Overview
The HTF EMA Pivot Points indicator displays Exponential Moving Averages (EMAs) from higher timeframes (HTF) on your current chart. These EMAs act as dynamic support and resistance levels, helping traders identify key areas where price is likely to react.
⚡ Key Features
✅ Plots EMAs from multiple timeframes (1H, 4H, Daily)
✅ Works on any chart (1M, 5M, 15M, etc.)
✅ Acts as pivot points for price action, helping with trade entries & exits
✅ Customizable EMA lengths for flexibility
✅ Ideal for scalping, 0DTE options trading, and swing trading
🛠 How It Works
The script calculates EMAs from 1H, 4H, and Daily charts and overlays them on your current timeframe. These levels often act as support and resistance zones, where price tends to bounce or reject.
🎯 How to Use It for Trading
📍 Bullish Setup (Buy Calls)
• Price bounces off a higher timeframe EMA (e.g., 4H or Daily EMA)
• Confirmation with RSI or Fair Value Gaps (FVGs)
📍 Bearish Setup (Buy Puts)
• Price rejects from a higher timeframe EMA
• Confirmation with other indicators (RSI, MACD, Order Flow)
🚀 Why Use This Indicator?
• Filters out noise from lower timeframe EMAs
• Confirms trend direction using key moving averages
• Helps avoid false breakouts by identifying strong institutional levels
This is a must-have tool for traders who rely on higher timeframe confluence for scalping, options trading, or swing trading. 📈🔥

HOD/LOD/PMH/PML/PDH/PDL Strategy by @tradingbauhaus This script is a trading strategy @tradingbauhaus designed to trade based on key price levels, such as the High of Day (HOD), Low of Day (LOD), Premarket High (PMH), Premarket Low (PML), Previous Day High (PDH), and Previous Day Low (PDL). Below, I’ll explain in detail what the script does:
Core Functionality of the Script:
Calculates Key Price Levels:
HOD (High of Day): The highest price of the current day.
LOD (Low of Day): The lowest price of the current day.
PMH (Premarket High): The highest price during the premarket session (before the market opens).
PML (Premarket Low): The lowest price during the premarket session.
PDH (Previous Day High): The highest price of the previous day.
PDL (Previous Day Low): The lowest price of the previous day.
Draws Horizontal Lines on the Chart:
Plots horizontal lines on the chart for each key level (HOD, LOD, PMH, PML, PDH, PDL) with specific colors for easy visual identification.
Defines Entry and Exit Rules:
Long Entry (Buy): If the price crosses above the PMH (Premarket High) or the PDH (Previous Day High).
Short Entry (Sell): If the price crosses below the PML (Premarket Low) or the PDL (Previous Day Low).
Long Exit: If the price reaches the HOD (High of Day) during a long position.
Short Exit: If the price reaches the LOD (Low of Day) during a short position.
How the Script Works Step by Step:
Calculates Key Levels:
Uses the request.security function to fetch the HOD and LOD of the current day, as well as the highs and lows of the previous day (PDH and PDL).
Calculates the PMH and PML during the premarket session (before 9:30 AM).
Plots Levels on the Chart:
Uses the plot function to draw horizontal lines on the chart representing the key levels (HOD, LOD, PMH, PML, PDH, PDL).
Each level has a specific color for easy identification:
HOD: White.
LOD: Purple.
PDH: Orange.
PDL: Blue.
PMH: Green.
PML: Red.
Defines Trading Rules:
Uses conditions with ta.crossover and ta.crossunder to detect when the price crosses key levels.
Long Entry: If the price crosses above the PMH or PDH, a long position (buy) is opened.
Short Entry: If the price crosses below the PML or PDL, a short position (sell) is opened.
Long Exit: If the price reaches the HOD during a long position, the position is closed.
Short Exit: If the price reaches the LOD during a short position, the position is closed.
Executes Orders Automatically:
Uses the strategy.entry and strategy.close functions to open and close positions automatically based on the defined rules.
Advantages of This Strategy:
Based on Key Levels: Uses important price levels that often act as support and resistance.
Easy to Visualize: Horizontal lines on the chart make it easy to identify levels.
Automated: Entries and exits are executed automatically based on the defined rules.
Limitations of This Strategy:
Dependent on Volatility: Works best in markets with significant price movements.
False Crosses: There may be false crosses that generate incorrect signals.
No Advanced Risk Management: Does not include dynamic stop-loss or take-profit mechanisms.
How to Improve the Strategy:
Add Stop-Loss and Take-Profit: To limit losses and lock in profits.
Filter Signals with Indicators: Use RSI, MACD, or other indicators to confirm signals.
Optimize Levels: Adjust key levels based on the asset’s behavior.
In summary, this script is a trading strategy that operates based on key price levels, such as HOD, LOD, PMH, PML, PDH, and PDL. It is useful for traders who want to trade based on significant support and resistance levels.

CANDLE STICK HEATMAPCANDLE STICK HEATMAP shows the statistics of a candle at a particular time. its very useful to find repeating pattern's at a particular time in a day.
based on the settings you can see regular repeating patterns of a day in an hourly chart. During a particular time in day there is always a down or up signal or candles.
The table boxes are candles in RED and GREEN based on open and close of the chart. The Heat map is very useful in analyzing the daily Hourly candlesticks in a week. The Time of each candlestick is plotted on the table along with default Indicators like RSI, MACD, EMA, VOLUME, ADX.
Additionally this can be used as a screener of candles on all timeframes. Analysis is easy when you want to see what happened exactly at a particular time in the previous hour, day, month etc.,
Hopefully additional updates will be introduced shortly.
Indicators:
1. MACD (close,12,26,9)
2.RSI (close,14)
3.EMA 200
3.Volume MA
Option is provided to show indicator statistics and time.
Color can be changed using settings.
Supports all Time Zones

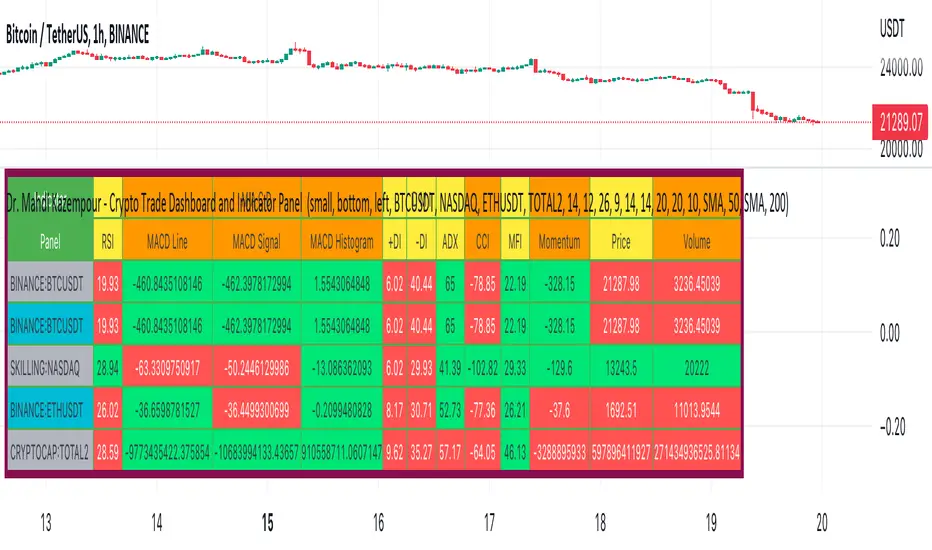
Dr. Mahdi Kazempour - Crypto Trade Dashboard and Indicator PanelA great panel for crypto traders all in one table:
Price, Volume, RSI, MACD, ADI, MOM
1) current symbol
2) BTCUSDT
3) NASDAQ
4) ETHUSDT
5) TOTAL2
Dilly DivergencesThis script calculates the time series of 5 indicators (Stochastic-RSI, RSI, MACD, CVD, and OBV) searches for divergences, and plots all divergences on the main price chart. Regular divergences = D; Hidden divergences = H

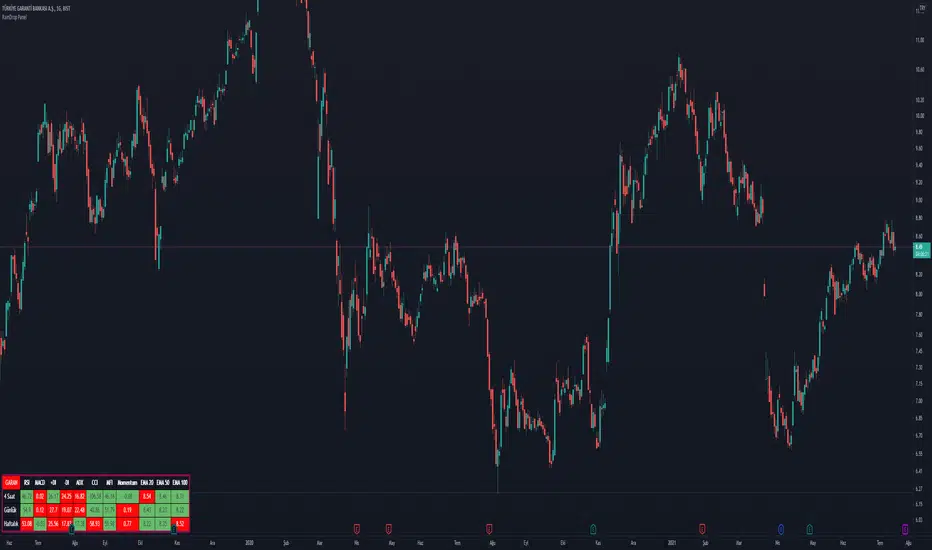
RainDrop PanelHi everyone,
This script shows the Dashboard in a Table. Table.new() is a new feature and released today! Big thanks to Pine Team for adding this great new feature!
This new feature changes the rules of the game! The script shows 3 different time period indicator values for the icon and changes the background color of each cell using the current and last values of the indicators for the icon. The background color is green if the current value is greater than the last value, red if it is less than the last value, and gray if it is equal. You can select the time periods and Indicators to be displayed. You can also change the position, font sizes, title and text colors of the relevant panel on the graphic. The number of columns in the table is dynamic and changes according to the number of indicators. You can choose 1 Symbol, 3 different timeframes, 6 Indicators and 4 Simple or Exponential Moving Averages, specify the type and length of moving averages. You can also set the lengths for each Indicator. Indicators: - RSI – MACD - DMI (+DI and -DI + and ADX) - CCI - MFI - Push - EMA Length 20 (length adjustable) - EMA Length 50 (length adjustable) EMA Length 100 (length adjustable) - EMA Length 200 (length adjustable)
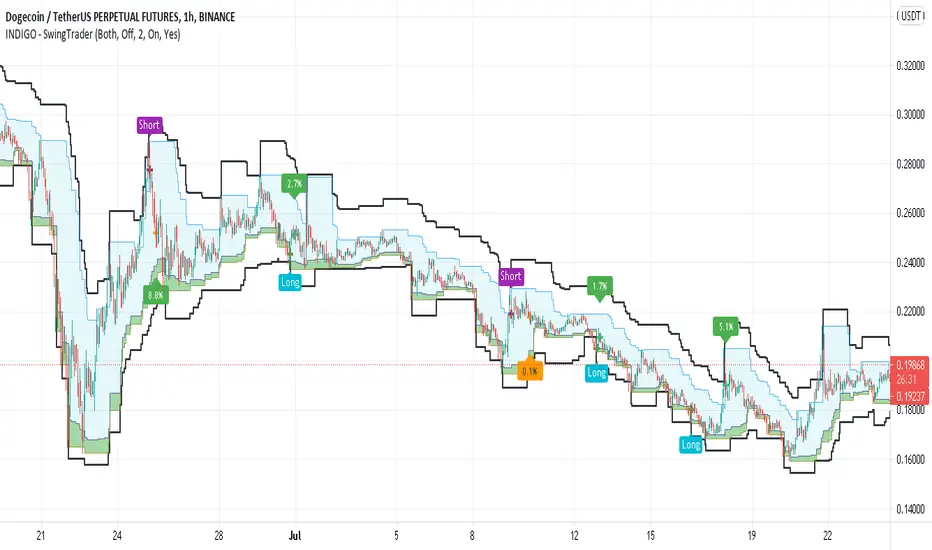
INDIGO - SwingTraderThis is a script that uses a couple of other indicators to find good swing trade entry's and exit's. You can choose which signals the script uses to calculate the position of the signals.
It uses the following:
- Stoch RSI
- MACD
- POC
- INDIGO Cloud
Also added are volume candles, acceleration of momentum indicators (triangle) and MACD candles. This way you can see more info to decide if the entry is valid.
I have used a couple of public scripts and tried to give credit to the original creators. If there is any script that hasn't been credited, please contact me.
Feedback is very much appreciated, positive and negative. Also If you have any question, feel free to ask me. I'll try to answer asap.
Enjoy the script :)
Divergence for Many Indicators v4Hello Traders,
Here is my new year gift for the community, Digergence for Many Indicators v4 . I tried to make it modular and readable as much as I can. Thanks to Pine Team for improving Pine Platform all the time!
How it works?
- On each candle it checks divergences between current and any of last 16 Pivot Points for the indicators.
- it search divergence on choisen indicators => RSI , MACD , MACD Histogram, Stochastic , CCI , Momentum, OBV, VWMACD, CMF and any External Indicator !
- it checks following divergences for 16 pivot points that is in last 100 bars for each Indicator.
--> Regular Positive Digergences
--> Regular Negative Digergences
--> Hidden Positive Digergences
--> Hidden Negative Digergences
- for positive divergences first it checks if closing price is higher than last closing price and indicator value is higher than perious value, then start searching divergence
- for negative divergences first it checks if closing price is lower than last closing price and indicator value is lower than perious value, then start searching divergence
Some Options:
Pivot Period: you set Pivot Period as you wish. you can see Pivot Points using "Show Pivot Points" option
Source for Pivot Points: you can use Close or High/Low as source
Divergence Type: you can choose Divergence type to be shown => "Regular", "Hidden", "Regular/Hidden"
Show Indicator Names: you have different options to show indicator names => "Full", "First Letter", "Don't Show"
Show Divergence Number: option to see number of indicators which has Divergence
Show Only Last Divergence : if you enable this option then it shows only last Positive and Negative Divergences
you can include any External Indicator to see if there is divergence
- enable "Check External Indicator"
- and then choose External indicator name in the list, "External Indicator"
- External indicator name is shown as Extrn
- related external indicator must be added before enabling this option
Coloring, line width and line style options for different type of divergences.
Following Alerts added:
- Positive Regular Divergence Detected
- Negative Regular Divergence Detected
- Positive Hidden Divergence Detected
- Negative Hidden Divergence Detected
Now lets see some examples:
Hidden Divergences:
Regular and Hidden Divergences together:
Showing first letters of indicators:
You can see only the number of indicators which has divergence:
You can see only divergence lines without indicators names and numbers:
option to used different label/line/text colors:
You have option to see only last divergences:
You can change Pivot Period, in following example Pivot Period = 15:
You can use Close or High/Low as Source for Divergence
You can include external indicators and get divergences on it:
Wish you all a happy new year!
Enjoy!

RogTrader HFT AlgoThis is a simple algorithm to generate Buy, Sell, Short, and Cover Signals. It uses the following:
RSI , MACD , Stochastic , Bollinger Bands , Ketler Channels, ATR Trailing Stop, Trend, and Volume .
Usage is simple: Green Background is Long and Red Background is Short positions.
LE = Long Entry
LX = Long Exit
SE = Short Entry
SX = Short Exit
This is not a trade recommendation, rather informative signals, and please do your due diligence. Thanks!

Confluence of Indicators and Signals v1 skvWhy this script
This script will display the buy or sell signals received from indicators, super trend, adx, rsi, macd, sma, and floor pivots along with some tweaked calculations and fixed numbers. This is useful for beginners who want to study the signals and timing to practice. This script is created for educational purpose and can be used for intraday scalping with 5 minutes time frame only after the signals are understood clearly.
How to use
Strong Buy - when series of buy/long signals generated by indicators, bright green up arrow indicates momentum/strength
Strong Sell - when series of sell/short signals generated by indicators, bright orange down arrow indicates momentum/strength
Exits - use the pivot lines, or the RSI-LX, SX exit signals. Also combine with Bollinger Bands to understand the exit points.
Look for reversals at pivot resistance and support.
Disclaimer
1. Only for educational purpose
2. Intraday scalping strategies only and on 5 min timeframe
3. Do paper trade before using any information for actual trading
4. Not swing or positional trade

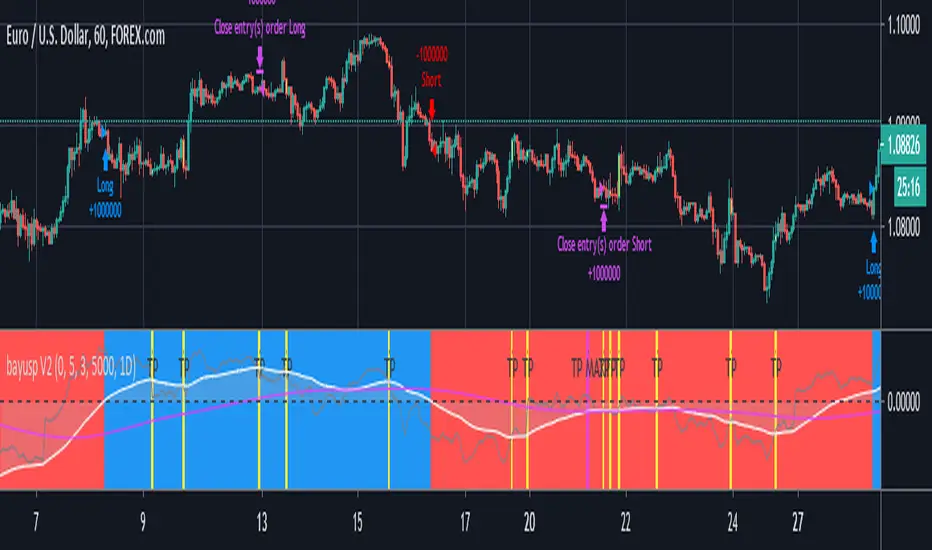
bayusp V2Using multi source like RSI , MACD , Stochastic , SMA , EMA and Huge Noural Network to Predicted Open Position.
Divergence Histogram for Many IndicatorHello Traders,
This script analyses divergences for 11 predefined indicators and then draws column on the graph. Red columns for negatif divergence (means prices may go down or trend reversal), Lime columns for positive divergences (means prices may go up or trend reversal)
The script uses Pivot Points and on each bar it checks divergence between last Pivot Point and current High/Low and if it finds any divergence then immediately draws column. There is no Latency/Lag.
There are predefined 11 indicators in the script, which are RSI , MACD , MACD Histogram, Stochastic , CCI , Momentum, OBV, Diosc, VWMACD, CMF and MFI.
Smaller Pivot Point Period check smaller areas and if you use smaller numbers it would be more sensitive and may give alerts very often. So you should set it accordingly.
There is "Check Cut-Through in indicators" option, I recomment you to enable it. it checks that there is cut-through in indicators or not, if no cut-through then it's shown as valid divergence.
You should see following one as well if you haven't yet:
Enjoy!

Divergence for many indicator v3Hello Everyone. Almost one year later, with Pine version 4, I developed new version of the Divergence for many Indicator.
It analyses divergences for 10 predefined indicators and then draws line on the graph. Red for negatif divergence (means prices may go down or trend reversal), Lime for positive divergences (means prices may go up or trend reversal)
Divergences version 2 has latency because it waits higher time frame completion. in this new version the script uses Pivot Points and on every bar it checks divergence between last Pivot point and current bar and if it finds any then immediately draws line and removes old one. so there is no latency with this version.
There are predefined 10 indicators in the script, you have option to choose which indicators the script would analyse for divergence. (RSI , MACD , MACD Histogram, Stochastic , CCI , Momentum, OBV, Diosc, VWMACD and CMF)
In replay mode you can see how the script puts new divergence line and removes old one. you better see it for yourself by using replay mode.
Hope you Enjoy!

CryptoEngineering 🔥Isn’t It Time You Made Your Crypto Portfolio Great Again? 🔥
The falling knives, the heartbreaking crashes, the devastating feeling of watching a missed trade soar all the way to the moon.
The markets aren’t fair, which means you need a tool that gives you an edge. So,It is time to try EngineeringRobo.
The Engineeringrobo is a great ally in a crypto market - when the price moves the algorithm will automatically show Buy and Sell orders when there is a best opportunity to make a profit. It is a just SMART trading system script on TradingView that brings the easiest approach to trading with a high profitability rate.
I created EngineeringRobo to help you on your traders as a robo advisor , It will "not " trade on behalf of you on exchanges via API. It is not an AI robot,It is am ALGO Trading robot. You can use it on any trading markets (BIST, S&P 500,Commodities ,Forex, Crypto ) with any time frame!
My unique algorithm find profitable altcoins based on their Ichimoku, McGinley, MA, RSI, MACD, Stochastic, Volumes and Price Changes gives you BUY and SELL signals. The EngineeringRobo indicator displays two different signals for entry and exit on a coin to maximize its profitability on the chart. The signals can appear at any time during an open candle, but once closed the signal is final and wont change in the future.
One of the biggest advantages of algo trading is removing human emotion from the crypto markets,humans trading are susceptible to emotions that lead to irrational decisions.Robo doesn't have to think or feel good to make a trade. If conditions are met, it enters.When the trade goes the wrong way or hits a profit target, It exits. It doesn't get angry at the market or feel invincible after making a few good trades. The two emotions that lead to poor decisions that algo traders aren't susceptible to are fear,and greed.
That's why It makes money but most of you not!
What Are the Advantages of using it as a ROBO Advisor?
🔴Reduce your required screen-time
🔴Reduce anxiety over missing setups when you are busy
🔴Turn existing indicators into alerts (eg. Whenever RSI goes overbought)
🔴Find comfort in knowing that you have me on your side
To get the maximized results from @EngineeringRobo
Open tradingview
Decide the coin/BTC
Pick 1M
Draw the Support & Resistance lines
Change the 1W
Draw the lines - Support & Resistance
Find out Chart Patterns
Change to 3D/1D / 3H
Check Robo' signals
Set your orders
Enjoy your profits💰
***Even the best automated day trading software can trigger false trends.
In August 2012 by Knight Capital group;who lost over $440 million in just half an hour when their trading software went rogue in response to market conditions. That's why it is a Robo advisor not trading bot! Engineeringrobo is not a get-rich-quick scheme as well!
Disclaimer
Information on EngineeringRobo should not be seen as a recommendation to trade BIST, S&P 500,Commodities ,Forex, Crypto.
EngineeringRobo is not licensed nor authorized to provide advice on investing and related matters.
Information on the page is not, nor should it be seen as investment advice.Any trading decisions that you make are solely your responsibility. Clients without sufficient knowledge should seek individual advice from an authorized source.
Crypto and Forex trading entails significant risks and there is a chance that clients lose all of their invested money. Past performance is not a guarantee of future returns. Before trading with any of the Algos, clients should make sure they understand the risks.
EngineeringRobo nor its agents or partners are not registered and do not provide any services on the US territory.
***I have been trading since 2016 . Got my first bitcoin in 2013

ANN MACD BTC v2.0 This script is the 2nd version of the BTC Deep Learning (ANN) system.
Created with the following indicators and tools:
RSI
MACD
MOM
Bollinger Bands
Guppy Exponential Moving Averages:
(3,5,8,10,12,15,30,35,40,45,50,60)
Note: I was inspired by the CM Guppy Ema script.
Thank you very much to dear wroclai for his great help.
He has been a big help in the deep learning series.
That's why the licenses in this series are for both of us.
I'm sharing these series and thats the first. Stay tuned and regards!
Note : Alerts added.

Divergence Ribbon (10 indicators)One of the most important signals for trend reversal is divergence.
This script finds divergences for 10 indicators and draws ribbon. So you can see which indicator has divergence. Red columns are negatif and lime columns are positive divergences. Divergences are searched from MinLength to MaxLength back, and you can change them as you wish.
Currently script checks divergence for RSI , MACD , MACD Histogram, Stochastic , CCI , Momentum, OBV, Diosc, VWMACD and CMF indicators.
If you find this script useful, please consider a donation
BTC: 16XRqyS3Vgh1knAU1tCcruqhUrVm4QWWmR

Divergences for many indicators v2.0A gift from me to all.
This script is developed to find Divergences for many indicators. it analyses divergences and then draws line on the graph. red for negatif, lime for positive divergences.
Currently script checks divergence for RSI, MACD, MACD Histogram, Stochastic, CCI, Momentum, OBV, Diosc, VWMACD and CMF indicators. You can use some or all of these indicators to check divergences as you wish by choosing them on the menu. Also you can add/remove many other indicators to the script to check if there is divergence.
The script first calculates tops/bottoms by using higher time frame zig zag and then finds divergences.
Higher Time Frames are
if currend period 1 min => HTF = 5 mins
if currend period 3 mins => HTF = 15 mins
if currend period 5 mins => HTF = 15 mins
if currend period 15 mins => HTF = 1 hour
if currend period 30 mins => HTF = 1 hour
if currend period 45 mins => HTF = 1 hour
if currend period 1 hour => HTF = 4 hours
if currend period 2 hours => HTF = 4 hours
if currend period 3 hours => HTF = 4 hours
if currend period 4 hours => HTF = 1 day
if currend period 1 day => HTF = 1 week
if currend period 1 week => HTF = 1 week
future plan : script finds regular divergences, soon I will add hidden divergences and also I plan to add alert ;)

Divergence/Convergence v1.0 [LonesomeTheBlue]The script is developed to find Divergence/Convergence for various indicators
it counts number of Divergence/Convergence and draws arrow
Arrow length changes according to number of Divergence/Convergence
that means if there is Divergence/Convergence on one indicator then arrow length = 1
if there is Divergence/Convergence on two indicator then arrow length = 2 etc.
Currently script checks Divergence/Convergence for RSI, MACD, MACD Histogram, Momentum, CMF indicators
You can add/remove many other indicators to check if there is Divergence/Convergence


profit_trailer_basktesting_v3I rewrite the code of v2.
There are some differences between v2:
1. PT 2.0 support multi-strategy up to 5. => the script have A...E buy inputs.
Not support new strategies now, I'm not sure how they work in PT 2.0, I will add them if the wiki complete.
you may find the options in setting, but they are placeholders.
I will not add the indicators for RSI, MACD, and STOCH RSI, please use the built-in indicator in Tradingview. There is no way to change overlay state of a script in pine script as I know or you can pm me if you know about it.
2. Trailing is disabled now.
I have no idea how it works in multi-strategy, I will enable it if the PT 2.0 release.
3. Now you can set indicator period in the setting, the unit of it is minute different from PT itself.
the entry price of orders still depending on your chart resolution, so I recommend you set the chart resolution same as the main strategy you want.
Like SOM trigger in V2, there is data range limit depend on the resolution you choose.
4. DCA is rewriting now.
And I will release an Anderson only version if I have time to complete it.
5. Add rebuy timer and stop loss timer. the value of it is candles. it will look back N candles on the chart.
Feel free to donate if you think my scripts are useful.
BTC:17eguEeVVnLmYK9iDKQNxBQmKWNENH4bGj
ETH:0xb172BBc4CDAB7F334243A312A46FB8492674A914
BCH:qpy0zulq9s4pcqu3hd2m8h8h7tfm83jz7qle0690c4
Price Divergence Detector V3 revised by JustUncleLThis is a revised version of the original "Price Divergence Detector by RicardoSantos".
Description:
Price Divergence detection for various methods : RSI, MACD, STOCH, VOLUME, ACC-DIST, FISHER, CCI, BB %B and Ehlers IdealRSI. Both Hidden and Regular Divergences are detected.
Mofidifications:
Revision 3.0 by JustUncleL
Added option to disable/enable Hidden and Regular Divergence
Added new divergence method BB %B (close only)
Added new divergence mothos Ehlers IdealRSI (close only)
Revision 2.0 - by RicardoSantos
References:
Information on Divergence Trading:
www.babypips.com
www.incrediblecharts.com (BB %B)
